Blog
Crowdsourcing for better infrastructure
 Riku Oja
Traditionally, city infrastructure planning has been a top-down business. From general guidelines drawn on a high political level, increasingly detailed plans have been made with little regard to local environment. Obviously, some level of general control and supervision of infrastructure is necessary, but it must be balanced with data on the physical reality, such as information on how the infrastructure is actually used, how it works in practice and what effects it has on the environment.
This latter part - the feedback from city back to the planning process - has been sorely lacking in the past. Especially in the 20th century, with its top-down centralized planning approach, in some cases decades passed before unintended results of previous plans were admitted and adjustments were made to the process. A case in point, a continuous increase in automotive traffic due to more motorways being built through a city was noticed in the 1960s, but traffic planning only recognized the phenomenon very slowly and reluctantly, essentially requiring a whole new generation of engineers and a complete paradigm shift before anything was done to combat the phenomenon, with its spiraling costs, in practice.
The software engineer will notice a striking resemblance to the traditional waterfall method of developing complex systems. This will result in user feedback taking years to filter up to the upper level and actually affect the possible next revision of the plan. This means a huge amount of costly infrastructure is essentially built without proper follow-up on whether the infrastructure is actually used and what its effects on the environment are. More often than not, the result is a huge waste of public resources.
The alternative, obviously, is to do lots of small infrastructure improvements, constantly gather data and feedback, iterate based on the results, and only continue those projects which are shown to be successful. While agile as a paradigm originated in the software industry, with suitable modifications it can be taken to infrastructure development. Large projects (a new bridge or a new transit line) obviously cannot be built if plans change constantly, but even in such cases, iterative development and responsive planning would do much to cut costs and ensure the best possible outcome.
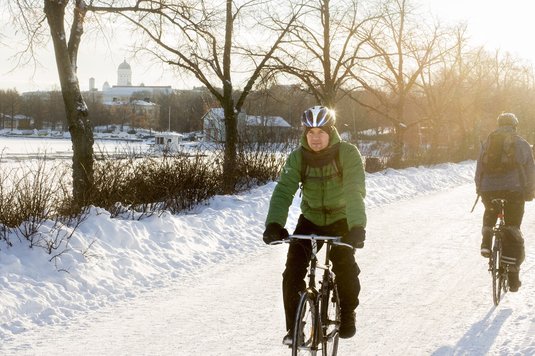
On the smaller scale, agile is much easier to put into practice in infrastructure. Most traffic infrastructure developments are small changes in an already existing system that is the city as a whole. A case in point is the new Helsinki City Bike system, which started with 50 bike stations last summer. First part of a modern transit system is obviously real-time data on the usage of bikes and stations, which allows analyzing the usage patterns and optimizing the system. However, usage statistics cannot predict the possible need of stations in areas not currently served by city bikes.
Therefore, as 100 more stations are due to be added next summer, Reetta Keisanen from the City Planning Department needed some actual feedback on where to expand the bike network. Working together with Jyrki Vanamo of Mapdon, we wanted to gather data from all current and potential users of the city bikes on where they would need a bike station. The resulting questionnaire was popular in record-breaking numbers, giving us approximately 5000 separate locations suggested by over 1300 users.
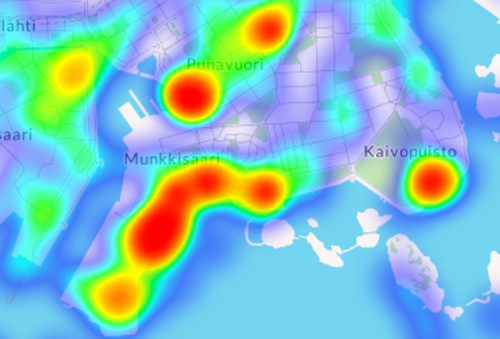 With such numbers, clear patterns could be seen on the data. One part of the city particularly popular on the map was Punavuori and Southern Helsinki, with its seaside attractions such as beach, sauna and cafes. Accordingly, new stations will be placed there next summer.
Other parts of the city that will receive new bike stations thanks to data from current users are Linjat and Merihaka in Kallio, as well as Käpylä as far north as the Käpylä train station. While planning a successful city bike network requires careful consideration on local people densities, their traffic patterns and links to other modes of transport, along with a suitable spacing of stations, the data as a whole proved invaluable in finding missing links and most needed expansion directions in the bike station network.
Another way we could assist traffic this winter is to try and improve reporting on bike lane maintenance. The Public Works Department is trying out different contractors and different winter maintenance methods on selected main bike routes throughout this winter. Our online map allows a constantly updating view on which lanes are considered by commuters to be in good condition on any given day, and which lanes have issues such as snow, ice or other surprises borne by the complex combination of city traffic, surprisingly changing weather conditions and a variety of maintenance contractors.
The aim of the service is to gather real-time data for all commuters on the condition of the bike lanes, but also act as a tool helping to develop winter maintenance, with users able to take photos on their cellphones on any problematic spots and tag them accordingly. Thus far, this winter has been mild, which is just as well as the map is still under testing and development, but at least we are prepared for changing weather conditions.
These are just a few prototype services that indicate the savings that could be had if constant gathering of data on infrastructure through crowdsourcing was the norm, not the exception, in city traffic. Services such as these could allow a more gradually improving traffic infrastructure that would meet the changing needs of local residents, with follow-up on whether the measures taken actually do count.
As always, the source code for both interactive maps is available, as is the source code of the Kerrokantasi service UI and backend.
For all the urban activists out there, obviously the questionnaire data are also available through the backend API. While the Kerrokantasi API is still very much a work in progress and our documentation is lacking, I am happy to help anybody interested in using the data.