Blog
Restful data
 Jussi Arpalahti
Well-formed Data at rest is as close to perfection in programming as it gets. All the crap that had to happen to put it there however..
Rufus Pollock from Open Knowledge Foundation visited our Helsinki ❤︎ Developers meeting during OKF’s MyData conference. He introduced us to the idea of frictionless data; making open data easier to discover, use and understand. Basically is a way to describe data using machine readable, yet lightweight and even human writable format based on JSON and bundles it alongside a universally supported format for data: comma separated file, CSV. Rather than describe how it works I thought I’d try it myself.
So, let’s see how first to make a Data Package for Tabular Data, as per instructions, and then we’ll see how to use it.
Data Production
This might concern everybody publishing open data, like we do at Helsinki: how to produce packages from datasets available at HRI.
Tabular data package looks like this:
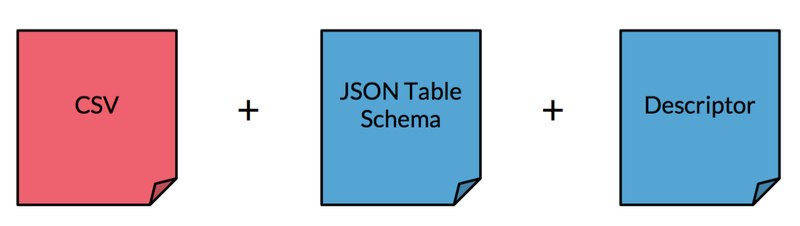
CSV we download from HRI. Descriptor and schema we have to either copy from dataset’s description page on HRI’s CKAN instance or from the CSV. I settled on third most popular dataset that contained CSV (at the time of writing the preceding two had no tabular).
First hurdle was making sense of the chosen CSV. For some reason it was saved in old Macintosh character set, but contained Finnish words which meant it wasn’t easily readable. If you put something on the web, ASCII or UTF-8 is probably safer bet and very likely everybody can read it. With some old school GNU/UNIX tools I got the CSV into readable form.
For this post the problem is that text in data is mostly in Finnish, so for educational purposes I proceeded to translate those. Now for the structure, the names and types of the column headers:
- Month of incident (month name in Finnish)
- Year of incident (four numbers)
- Address (street name and number)
- State of ticket payment (text)
- Incident class / Incident’s chief reason (text again)
- Incident's scribe (this is text)
Now this information needs to be transferred to a data package. I used the packaging tool and copied the descriptions from HRI’s page and explained the headers from CSV. This part of the process took five minutes. I only uploaded few lines from the entire 40 MB file so that the tool could deduce CSV’s format automatically. This is the Data Package’s JSON it gave me.
I noticed that the package loader could recognize fields even though CSV’s delimiter was ”;” and not ”,” as per default. However, Data Package tools were less forgiving. For expediency’s sake I changed delimiter to comma. Because these aren’t Semicolon Separated Files ;)
And there you go: frictionless data.
Data use
Now we switch roles to an aspiring data user. This might even be you, interested to get the data, load it into your choice of tools, and gain understanding. I myself use Python, Jupyter Notebook and Pandas.
Having read this blog post about using data packages with Pandas, I proceeded to install required packages, start Jupyter Notebook session and load the data. This part took few minutes and went, well, frictionlessly.
You can see the process with code and results, with a picture here.
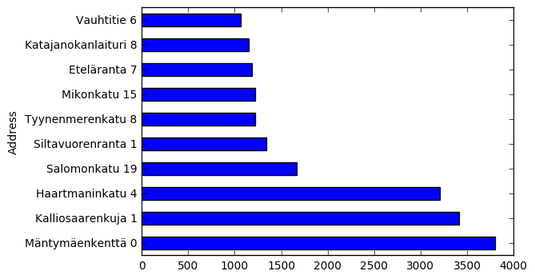
I decided to find which addresses and street names have most parking tickets issued, because it can be shown nicely as a bar graph.
I did find the most ticketed address (hint: it’s not what you might think). Making slightly more useful statistics out of the data would require transferring addresses from individual house numbers to street sections where you can actually park (I’m sure I can find that data somewhere, perhaps in a next blog post), getting their coordinates to show them on a map. Perhaps you could compare this data to a list of all possible parking spaces so that you could find the least ticketed places.
Conclusion
I wore two hats for this post. First I had to make a data package from our existing data with data publisher hat on and then I got to wear data user hat when trying to make sense of the data. Idea in frictionless data, or at least what I’ve gathered, is that there’s no friction in its use from your tools. Understanding data is somewhat harder task and making that easier might be our next goal.
Making a data package didn’t seem too hard, but I’d like to use more specific types with its schemas, like street address and year instead of string and integer. Tools like Pandas can benefit immensely if your data has machine recognizable structure. I published the package to Github, where it’ll be certainly available but not easily findable. Having our data portal, hri.fi, serve it directly, perhaps through its API could streamline the process greatly.
Come join us at our Gitter channel for discussion!

Incidentally, here's a new use case for parking space. No tickets here.